SO2 from SCIAMACHY
measurements
 Introduction:
Sulphur dioxide (SO2) is emitted into the atmosphere in large amounts by volcanic eruptions and degassing. Another natural source is oxidation of sulphur gases produced by the decomposition of plants. Anthropogenic emissions are dominated by fossil fuel burning, in particular of high sulphur coal, refineries of oil and gas and nonferrous smelting. In the atmosphere, high concentrations of SO2 not only adversely affect human health but also contribute to acid rain and the resulting damage to the ecosystem. In addition, SO2 is closely linked to aerosol formation via sulphuric acid (H2SO4) with links to CCN formation, cloud droplet size and feedback mechanisms in climate forcing as well as heterogeneous chemistry.
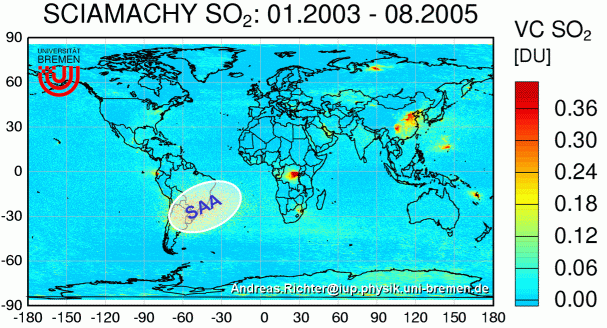
SO2 columns are retrieved from SCIAMACHY measurements in the 315 - 327 nm wavelength region. As result of the large ozone absorption in this region, the intensity of the backscattered radiation is low at these wavelengths and interference by ozone a problem. Also, as result of increased Rayleigh scattering in the UV, the sensitivity of the measurements drops towards the surface. However, if signals are large enough or the SO2 concentrated in the middle or upper troposphere, clear SO2 signals can be observed in the satellite data. As an example, a 32 month average of SCIAMACHY SO2 is shown in the figure, highlighting areas of large pollution (e.g. China or the Highveld region in South Africa), volcanic eruptions (e.g. Nyamuragira in the Democratic Republic of Congo, El Reventador in South America), refineries in the Persian Gulf and smelting in Russia. For the figure, it was assumed that SO2 is located in the middle troposphere which leads to substantial underestimation of SO2 where it is concentrated in the boundary layer.
 Data:
Data:
SO2 columns from SCIAMACHY measurements are available from August 2002 onwards. Currently, the analysis is based on a rather limited set of both uncalibrated and calibrated data that have been released by ESA, and therefore has to be considered as preliminary. In the current data version, we use a constant airmass factor assuming that the SO2 is located in the free troposphere. This will give reasonable results for volcanic eruptions, but strongly underestimate SO2 from pollution which is often located in the boundary layer.
Images of daily, monthly, and annual averages of tropospheric SO2 can be viewed on our SCIAMACHY data browser page.
There still are unresolved problems in the SO2 data analysis (e.g. over bright surfaces), and we are working on solutions. As soon as we have a reasonable data version, we will post it in our data archive.
A short description of the algorithm used for the SO2 data product can be found in the SO2 Algorithm Description.
 References:
- Lee, C., Richter, A., Lee, H., Kim, Y. J., Burrows, J. P., Lee, Y. G., , Choi, B.C., Impact of transport of sulfur dioxide from the Asian continent on the air quality over Korea during May 2005, Atmospheric Environment, 42, 1461–1475, 2008
- Afe, O. T., A. Richter, B. Sierk, F. Wittrock and J. P. Burrows, BrO Emission from Volcanoes - a Survey using GOME and SCIAMACHY Measurements, Geophys. Res.Lett., 31, L24113, doi:10.1029/2004GL020994, 2004
- Eisinger, M., and J. P. Burrows, Tropospheric Sulfur Dioxide observed by the ERS-2 GOME Instrument, Geophys. Res. Lett., No. 25, pp. 4177-4180, 1998.
 Links:
-
More information on SCIAMACHY can be found here.
-
Many SCIAMACHY related links can be found on the German SCIAMACHY page.
-
For information on the satellite and other ENVISAT instruments check the ESA ENVISAT page.
 Contact:
If you are interested in more information or SCIAMACHY SO2 data, please contact Andreas Richter.
