Navigate
![]()
GOME-2 / OMI support for OMO
Introduction Data References Links Contact
 Introduction:
 |
OMO - Oxidation Mechanism Observations is a measurement campaign with the German High Altitude – Long-range research aircraft (HALO). It addresses the “self-cleaning capacity” of the atmosphere by focusing on oxidation processes and air pollution chemistry downwind of South Asia during the summer monsoon. The measurements take place in July and August 2015 in the upper troposphere at 10-15 km altitude. The goal is to study the role of convective clouds and rainfall on atmospheric composition during the monsoon. While soluble gases and aerosol particles can rain out, the removal efficiency is poorly known. Monsoon clouds can have a strong and large-scale impact on atmospheric chemistry through the vertical redistribution of sunlight, pollutants and humidity. The chemical, transport and deposition processes are investigated to advance computer models and improve air quality and climate change calculations. |
 Data:
Data:
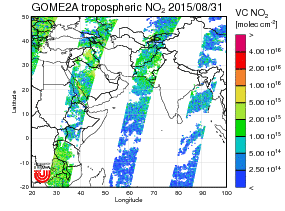
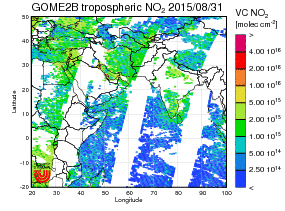
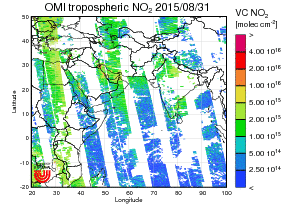
The IUP-Bremen provides near realtime tropospheric NO2 columns from the GOME-2 instruments on Metop-A and MetOp-B as well as OMI on Aura to support flight planning and quick look interpretation of the OMO field campaign in July / August 2015. This is not the official EUMETSAT / NASA NO2 product but a scientific retrieval performed at the IUP Bremen. All plots are produced automatically and without explicit quality control. Usually, the plots should be available 6 hours after measurement. If you experience any problems, please contact Andreas Richter.
Latest images


GOME-2 MetOp A NO2 image archive
|
| |||||
GOME-2 MetOp B NO2 image archive
|
| |||||
OMI NO2 image archive
|
| |||||
The products shown here are derived at the IUP Bremen. NO2 columns are calculated using the method described in Richter et al., 2005, Richter et al., 2011, and Hilboll et al., 2014. The retrievals are based on GOME-2 lv1 data provided by EUMETSAT and OMI lv1 data provided by NASA. They are not official GOME-2 / OMI data products. If you want to use them for something else than a quick-look check, please contact us for a consolidated version.
Much more GOME2 and SCIAMACHY data are accessible via our data browser page and the SCIAMACHY data archive.
More GOME-2 data is available in our group off-line. If you have any requests, please contact Andreas Richter.
 References:
- Hilboll, A., Richter, A., and Burrows, J. P.: Long-term changes of tropospheric NO2 over megacities derived from multiple satellite instruments, Atmos. Chem. Phys., 13, 4145-4169, doi:10.5194/acp-13-4145-2014, 2014
- Richter, A., Begoin, M., Hilboll, A., and Burrows, J. P.: An improved NO2 retrieval for the GOME-2 satellite instrument, Atmos. Meas. Tech. , 4, 1147-1159, doi:10.5194/amt-4-1147-2011, 2011
- Richter, A., Burrows, J. P., Nüß, H., Granier, C, Niemeier, U., Increase in tropospheric nitrogen dioxide over China observed from space, Nature, 437, 129-132, doi: 10.1038/nature04092, 2005
 Links:
- More on GOME-2 can be found on our GOME-2 page.
-
More on SCIAMACHY tropospheric NO2 can be found on our SCIAMACHY NO2 page.
 Contact:
If you are interested in more information or SCIAMACHY and GOME-2 tropospheric data, please contact Andreas Richter.